
目次
1. ランド指数 (Rand Index)の概要
1.1 ランド指数 (Rand Index)の概要
1.2 scikit-learnのランド指数
2. 実験
2.1データセット生成
2.2 KMeansのランド指数
2.3 dbscanのランド指数
2.4 MeanShiftのランド指数
2.5 まとめ
1. ランド指数 (Rand Index)の概要
1.1 ランド指数 (Rand Index)とは
ランド指数 (Rand Index)は、2つのクラスタリング間の類似度を計算します。
Rand indexは下の式で計算します。
ARI = (RI – Expected_RI) / (max(RI) – Expected_RI)
例えば、
Cluster1: 1, 2, 1, 1, 2 Cluster2: 1, 1, 2, 1, 2
= (2 + 2) / (2 + 3 + 3 + 2)
= 0.4
adjusted_rand_scoreは0~1間の値です。1に近い程2つのクラスタリング間が似ています。0に近い程2つのクラスタリング間が似ていません。
1.2 scikit-learnのランド指数
sklearn.metrics.adjusted_rand_score(labels_true, labels_pred)
labels_trueint array, shape = [n_samples]
クラスのリスト
labels_predarray-like of shape (n_samples,)
クラスのリスト
資料:https://scikit-learn.org/stable/modules/generated/sklearn.metrics.adjusted_rand_score.html
2. 実験
環境: Google Colab
データセット:make_blobls() は、クラス分類のためのデータを生成します。
モデル:KMeansのランド指数、dbscanのランド指数、MeanShiftのランド指数
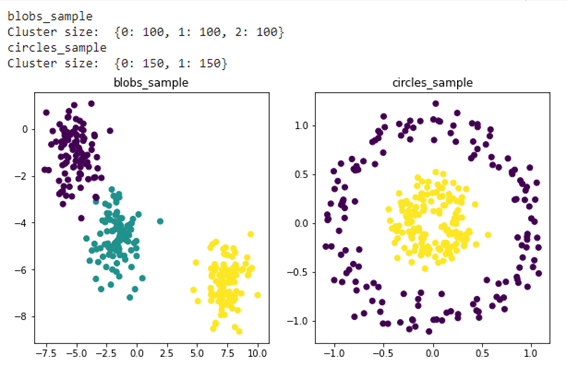
2.1 データセット生成
make_blobsで3つのクラスターとmake_circlesで2つのクラスターを作成しました。
| import numpy as np from sklearn import datasets import matplotlib.pyplot as plt SEED = 33
from sklearn.datasets import make_blobs, make_circles data, label = make_blobs(n_samples=300, centers=3, n_features=2, cluster_std=1, random_state=SEED) data2, label2 = make_circles(n_samples=300, noise=0.1, random_state=SEED, factor=0.3)
X = data[:,0] y = data[:,1] X2 = data2[:,0] y2 = data2[:,1]
unique, counts = np.unique(label, return_counts=True) print(‘Cluster size: ‘, dict(zip(unique, counts)))
# Plot result fig, (ax1, ax2) = plt.subplots(1, 2, figsize=(10,5)) fig.subplots_adjust(hspace=0.2, wspace=0.2) ax1.set_title(‘blobs_sample’) ax1.scatter(X, y, c=label) ax2.set_title(‘circles_sample’) ax2.scatter(X2, y2, c=label2); |
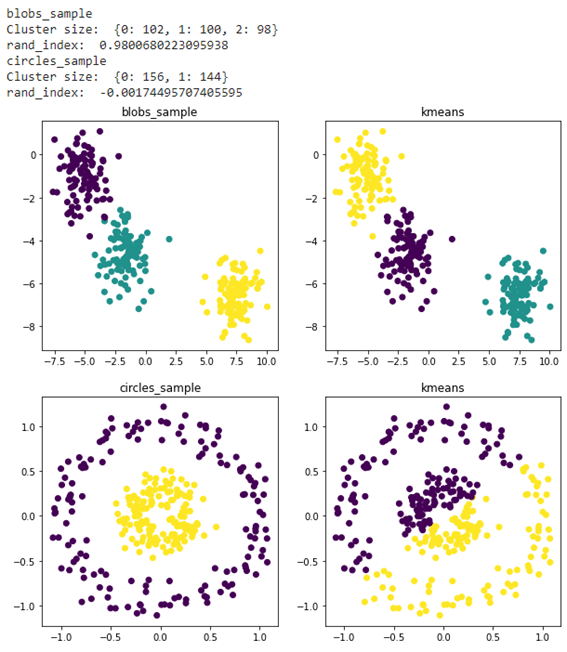
2.2 KMeansのランド指数
Kmeans つのクラスターを学習しました。Blobのrand_indexは0.9800、Circleのrand_indexは-0.0017で大きく異なる結果でした。
k-means++の記事: LINK
| # Kmeans library from sklearn.cluster import KMeans from sklearn.metrics.cluster import adjusted_rand_score
# kmeans kmeans = KMeans(n_clusters=3, random_state=SEED).fit(data) kmeans_cluster = kmeans.labels_ kmeans2 = KMeans(n_clusters=2, random_state=SEED).fit(data2) kmeans_cluster2 = kmeans2.labels_
# cluster print(‘blobs_sample’) unique, counts = np.unique(kmeans_cluster, return_counts=True) print(‘Cluster size: ‘, dict(zip(unique, counts))) rand_index = adjusted_rand_score(label, kmeans_cluster) print(‘rand_index: ‘, rand_index)
print(‘circles_sample’) unique2, counts2 = np.unique(kmeans_cluster2, return_counts=True) print(‘Cluster size: ‘, dict(zip(unique2, counts2))) rand_index2 = adjusted_rand_score(label2, kmeans_cluster2) print(‘rand_index: ‘, rand_index2)
# Plot result fig, ax = plt.subplots(2, 2, figsize=(10,10)) fig.subplots_adjust(hspace=0.2, wspace=0.2) ax[0, 0].set_title(‘blobs_sample’) ax[0, 0].scatter(X, y, c=label) ax[0, 1].set_title(‘kmeans’) ax[0, 1].scatter(X, y, c=kmeans_cluster); ax[1, 0].set_title(‘circles_sample’) ax[1, 0].scatter(X2, y2, c=label2) ax[1, 1].set_title(‘kmeans’) ax[1, 1].scatter(X2, y2, c=kmeans_cluster2);
|
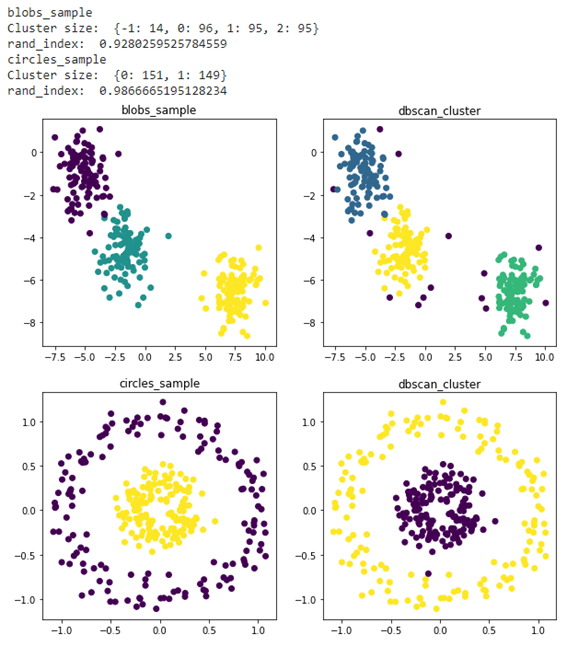
2.3 dbscanのランド指数
Dbscanのクラスター分析はよくできました。Blobのrand_index: 0.9280とCircleのrand_index: 0.9866の結果になりました。
DBSCANクラスタリングの解説と実験の記事:LINK
| # DBSCAN library from sklearn.cluster import DBSCAN from sklearn.metrics.cluster import adjusted_rand_score
# DBSCAN dbscan = DBSCAN(eps=1, min_samples=10).fit(data) dbscan_cluster = dbscan.labels_ dbscan2 = DBSCAN(eps=0.3, min_samples=10).fit(data2) dbscan_cluster2 = dbscan2.labels_
# cluster print(‘blobs_sample’) unique, counts = np.unique(dbscan_cluster, return_counts=True) print(‘Cluster size: ‘, dict(zip(unique, counts))) rand_index = adjusted_rand_score(label, dbscan_cluster) print(‘rand_index: ‘, rand_index)
print(‘circles_sample’) unique2, counts2 = np.unique(dbscan_cluster2, return_counts=True) print(‘Cluster size: ‘, dict(zip(unique2, counts2))) rand_index2 = adjusted_rand_score(label2, dbscan_cluster2) print(‘rand_index: ‘, rand_index2)
# Plot result fig, ax = plt.subplots(2, 2, figsize=(10,10)) fig.subplots_adjust(hspace=0.2, wspace=0.2) ax[0, 0].set_title(‘blobs_sample’) ax[0, 0].scatter(X, y, c=label) ax[0, 1].set_title(‘dbscan_cluster’) ax[0, 1].scatter(X, y, c=dbscan_cluster); ax[1, 0].set_title(‘circles_sample’) ax[1, 0].scatter(X2, y2, c=label2) ax[1, 1].set_title(‘dbscan_cluster’) ax[1, 1].scatter(X2, y2, c=dbscan_cluster2); |
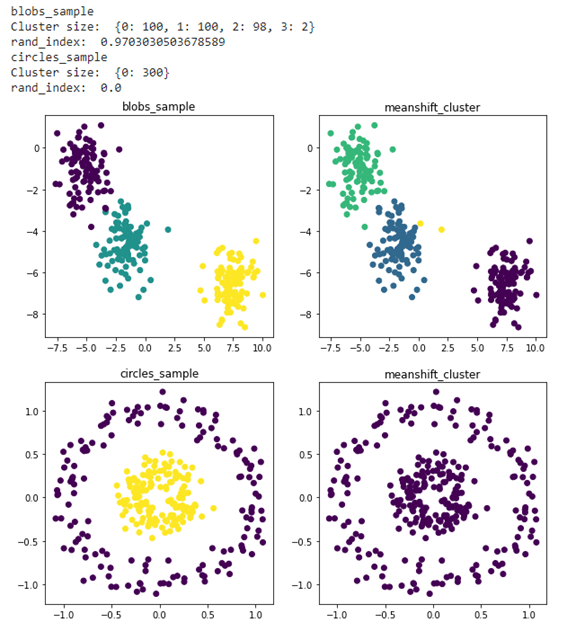
2.4 MeanShiftのランド指数
MeanShift のクラスターに分けました。Blobのrand_index: 0.9703とCircleのrand_index: 0.0になります。Circleに対して、クラスターを作成できませんでした。
| # MeanShift library from sklearn.cluster import MeanShift from sklearn.metrics.cluster import adjusted_rand_score
# MeanShift meanshift = MeanShift(bandwidth=1.5).fit(data) meanshift_cluster = meanshift.labels_ meanshift2 = MeanShift(bandwidth=1.5).fit(data2) meanshift_cluster2 = meanshift2.labels_
# cluster print(‘blobs_sample’) unique, counts = np.unique(meanshift_cluster, return_counts=True) print(‘Cluster size: ‘, dict(zip(unique, counts))) rand_index = adjusted_rand_score(label, meanshift_cluster) print(‘rand_index: ‘, rand_index)
print(‘circles_sample’) unique2, counts2 = np.unique(meanshift_cluster2, return_counts=True) print(‘Cluster size: ‘, dict(zip(unique2, counts2))) rand_index2 = adjusted_rand_score(label2, meanshift_cluster2) print(‘rand_index: ‘, rand_index2)
# Plot result fig, ax = plt.subplots(2, 2, figsize=(10,10)) fig.subplots_adjust(hspace=0.2, wspace=0.2) ax[0, 0].set_title(‘blobs_sample’) ax[0, 0].scatter(X, y, c=label) ax[0, 1].set_title(‘meanshift_cluster’) ax[0, 1].scatter(X, y, c=meanshift_cluster); ax[1, 0].set_title(‘circles_sample’) ax[1, 0].scatter(X2, y2, c=label2) ax[1, 1].set_title(‘meanshift_cluster’) ax[1, 1].scatter(X2, y2, c=meanshift_cluster2);
|
2.5 まとめ
KMeans、dbscan、MeanShiftのクラスター分析の結果より、ランド指数を比較しました。ランド指数でクラスタリングの類似度を確認しました。この結果から分類が大きく異なる際は、ランド指標も異なる事がわかりました。

担当者:KW
バンコクのタイ出身 データサイエンティスト
製造、マーケティング、財務、AI研究などの様々な業界にPSI生産管理、在庫予測・最適化分析、顧客ロイヤルティ分析、センチメント分析、SaaS、PaaS、IaaS、AI at the Edge の環境構築などのスペシャリスト