
目次
1. DET曲線とは
2. sci-kit learnのDET曲線
3. 実験
_3.1 環境構築
_3.2 データ生成
_3.3 モデル作成
_3.4 DET曲線の計算
_3.5 DET曲線の可視化
1. DET曲線とは
DET曲線とは、Detection Error Tradeoff curvesの略称で、二項分類システムのエラー率のグラフプロットであり、偽陽性率(False positive rate)と偽陰性率(False negative rate)をプロットします。DET曲線には、2種類の試行の基礎となるスコア分布が正常である場合、曲線が直線になるという特性があります。
2. sci-kit learnのDET曲線
| sklearn.metrics.det_curve(y_true, y_score, pos_label=None, sample_weight=None) |
パラメーター
y_truendarray of shape (n_samples,)
ラベルが{-1、1}または{0、1}のいずれでもない場合は、pos_labelを明示的に指定する必要があります。
y_scorendarray of shape of (n_samples,)
ターゲットスコアは、正のクラスの確率推定値、信頼値、またはしきい値以外の決定の尺度(一部の分類子の「decision_function」によって返される)のいずれかです。
pos_labelint or str, default=None
ポジティブクラスのラベル。 pos_label = Noneの場合、y_trueが{1、1}または{0、1}の場合、pos_labelは1に設定されます。それ以外の場合は、エラーが発生します。
sample_weightarray-like of shape (n_samples,), default=None
サンプルの重み。
| sklearn.metrics.plot_det_curve(estimator, X, y, *, sample_weight=None, response_method=’auto’, name=None, ax=None, pos_label=None, **kwargs) |
パラメーター
estimatorestimator instance
適合分類器または最後の推定量が分類器である適合パイプライン。
X{array-like, sparse matrix} of shape (n_samples, n_features)
入力値
yarray-like of shape (n_samples,)
目標値
sample_weightarray-like of shape (n_samples,), default=None
サンプルの重み。
response_method{‘predict_proba’, ‘decision_function’, ‘auto’} default=’auto’
予測されるターゲット応答としてpredict_probaまたはdecision_functionのどちらを使用するかを指定します。 「auto」に設定されている場合、predict_probaが最初に試行され、存在しない場合は、decision_functionが次に試行されます。
namestr, default=None
ラベル付け用のDET曲線の名前。 Noneの場合、推定量の名前を使用します。
axmatplotlib axes, default=None
プロットするオブジェクトを軸します。 Noneの場合、新しい図と軸が作成されます。
pos_labelstr or int, default=None
ポジティブクラスのラベル。 pos_label = Noneの場合、y_trueが{1、1}または{0、1}の場合、pos_labelは1に設定されます。それ以外の場合は、エラーが発生します。
3. 実験
環境:Colab
データセット:1,000件のデータセットを生成します。
モデル:svm
モデル評価:DET曲線
3.1 環境構築
Sci-kit learnのバージョンを更新します。
| !pip install -U scikit-learn==0.24.1 |
Sci-kit learnのバージョンを確認します。
| import sklearn sklearn.__version__ |
0.24.1
ライブラリインポート
| import matplotlib.pyplot as plt from sklearn.datasets import make_classification from sklearn.model_selection import train_test_split from sklearn import datasets, metrics, model_selection, svm from sklearn.metrics import plot_det_curve |
3.2 データ生成
1000件のセータセットを生成します。
| N_SAMPLES = 1000
X, y = make_classification( n_samples=N_SAMPLES, n_features=2, n_redundant=0, n_informative=2, random_state=1, n_clusters_per_class=1)
print(X.shape, y.shape) |
(1000, 2) (1000,)
学習とテストデータを分けます。
| X_train, X_test, y_train, y_test = train_test_split( X, y, test_size=.4, random_state=0)
print(X_train.shape, X_test.shape, y_train.shape, y_test.shape) |
(600, 2) (400, 2) (600,) (400,)
3.3 モデル作成
SVMモデルを学習します。
| clf = svm.SVC(random_state=0) clf.fit(X_train, y_train) |
3.4 DET曲線の計算
det_curveでDET曲線を計算します。下記の出力を計算します。
False positive rate (FPR):偽陽性率
False negative rate (FNR):偽陰性率
Threshold:最小になる閾値
| y_pred = clf.predict(X_test) fpr, fnr, thresholds = metrics.det_curve(y_test, y_pred) print(fpr, fnr, thresholds) |
[1. 0.14691943] [0. 0.03174603] [0 1]
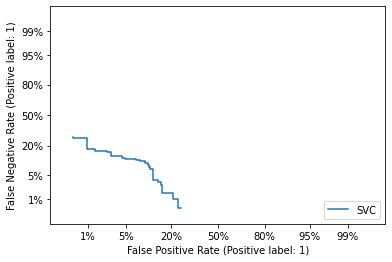
3.5 DET曲線の可視化
DET曲線図をプロットします。
| metrics.plot_det_curve(clf, X_test, y_test) plt.show() |

担当者:KW
バンコクのタイ出身 データサイエンティスト
製造、マーケティング、財務、AI研究などの様々な業界にPSI生産管理、在庫予測・最適化分析、顧客ロイヤルティ分析、センチメント分析、SaaS、PaaS、IaaS、AI at the Edge の環境構築などのスペシャリスト