正則化項を加えるメリットは以下になります。
1.変数が多い時に発生する過学習を抑える事が出来る。
2.相関があるような変数の影響を抑える事が出来る(但し一致性は保証されない)。
3.相関の高い変数群がある場合、Lasso/Ridgeはその中の1つしか変数として選択できない。
4.係数が小さくなる。
Ridge回帰
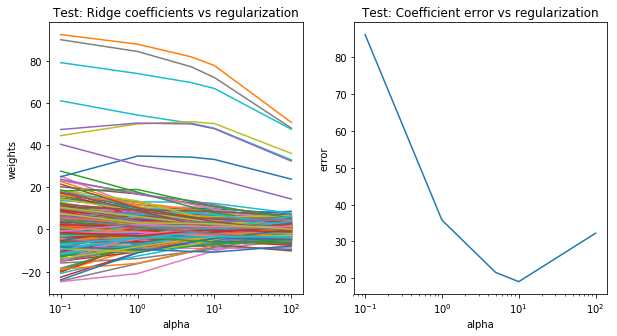
Ridge回帰では、L2正則化を用いています。L2ノルム(係数のユークリッド長)に対してペナルティを与えます。alpha値を設定することにより、係数への制約を調整できます。
pythonでRidge回帰を作成しましょう。先ず、ライブラリーのインポートとデータセットを作成します。
import matplotlib.pyplot as plt
import numpy as np
from sklearn.cross_validation import train_test_split
from sklearn.datasets import make_regression
from sklearn.linear_model import Ridge
from sklearn.metrics import mean_squared_error
# サンプルデータ作成 1000サンプル、300 特徴量
X, y, w = make_regression(n_samples=1000, n_features=300, coef=True,
random_state=1, bias=3.5, noise=35)
モデル作成し、test scoreを計算します。
alphas = 0.1, 1,5, 10, 100
# 学習 テスト 分ける
X_train,X_test,y_train,y_test=train_test_split(X,y,test_size=0.3,random_state=3)
clf = Ridge()
coefs = []
errors = []
alphas = (0.1,1,5,10,100)
# モデル作成
for a in alphas:
clf.set_params(alpha=a)
clf.fit(X_test, y_test)
coefs.append(clf.coef_)
errors.append(mean_squared_error(clf.coef_, w))
test_score = clf.score(X_test, y_test)
print (“Alpha:”, a , “Test score:”,test_score)
Alpha: 0.1 Test score: 0.9993611779278784
Alpha: 1 Test score: 0.9988451882265523
Alpha: 5 Test score: 0.9970055443567917
Alpha: 10 Test score: 0.9945472760914889
Alpha: 100 Test score: 0.9392489168770195
# 図作成
plt.figure(figsize=(20, 6))
plt.subplot(121)
ax = plt.gca()
ax.plot(alphas, coefs)
ax.set_xscale(‘log’)
plt.xlabel(‘alpha’)
plt.ylabel(‘weights’)
plt.title(‘Test: Ridge coefficients as a function of the regularization’)
plt.axis(‘tight’)
plt.subplot(122)
ax = plt.gca()
ax.plot(alphas, errors)
ax.set_xscale(‘log’)
plt.xlabel(‘alpha’)
plt.ylabel(‘error’)
plt.title(‘Test: Coefficient error as a function of the regularization’)
plt.axis(‘tight’)
plt.show()

最もerrorが低いのがalpha10の時になっています。
Lasso回帰
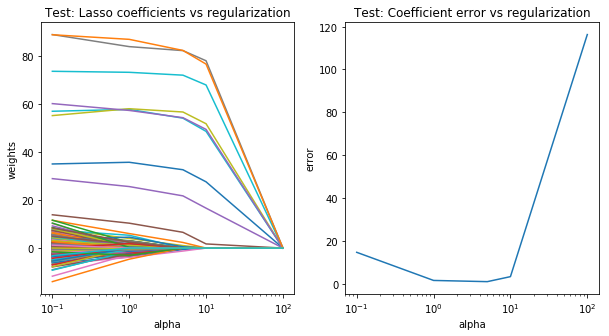
Lassoでは、L1ノルム(係数の絶対値の和)にペナルティを与えます。Lassoの場合、いくつかの係数が完全に0になるため、特徴選択として用いる事ができます。そのため、モデルの解釈がしやすくなります。
pythonでLasso回帰を同じように作成しましょう。
import numpy as np
import matplotlib.pyplot as plt
from sklearn.cross_validation import train_test_split
from sklearn.datasets import make_regression
from sklearn.linear_model import Lasso
from sklearn.metrics import mean_squared_error
# サンプルデータ作成 1000サンプル、300 特徴量
X, y, w = make_regression(n_samples=1000, n_features=300, coef=True,
random_state=1, bias=3.5, noise=35)
# 学習 テスト 分ける
X_train,X_test,y_train,y_test=train_test_split(X,y,test_size=0.3,random_state=3)
clf = Lasso()
coefs = []
errors = []
alphas = (0.1,1,5,10,100)
# モデル作成
for a in alphas:
clf.set_params(alpha=a)
clf.fit(X_test, y_test)
coefs.append(clf.coef_)
errors.append(mean_squared_error(clf.coef_, w))
test_score = clf.score(X_test, y_test)
print (“Alpha:”, a , “Test score:”,test_score)
# 図作成
plt.figure(figsize=(10, 5))
plt.subplot(121)
ax = plt.gca()
ax.plot(alphas, coefs)
ax.set_xscale(‘log’)
plt.xlabel(‘alpha’)
plt.ylabel(‘weights’)
plt.title(‘Test: Lasso coefficients vs regularization’)
plt.axis(‘tight’)
plt.subplot(122)
ax = plt.gca()
ax.plot(alphas, errors)
ax.set_xscale(‘log’)
plt.xlabel(‘alpha’)
plt.ylabel(‘error’)
plt.title(‘Test: Coefficient error vs regularization’)
plt.axis(‘tight’)
plt.show()
Alpha: 0.1 Test score: 0.9975982692379306
Alpha: 1 Test score: 0.9849066862787251
Alpha: 5 Test score: 0.9625892472857361
Alpha: 10 Test score: 0.9423213191363434
Alpha: 100 Test score: 0.0
最もerrorが低いのがalpha10の時になっています。

