データの2つの系列間の相関関係は統計では一般的な操作になります。今回の記事はPySparkで相関行列行います。PythonのPandasとSpark MLで相関行列を計算してSeabornでヒートマップ表を作成するやり方を比較します。
目次
1.環境とライブラリ(Spark ML)
2.相関行列とは
3.実験のコード
3.1 データセットのロード
3.2 Pandasの相関行列
3.3 ヒートマップ表
3.4 Spark MLの相関行列
3.5ヒートマップ表
4. まとめ
環境
Databricks:
Runtime: 5.5 LTS ML (includes Apache Spark 2.4.3, Scala 2.11)
5.5 LTS MLはSpark MLのライブラリがあります。
Spark ML
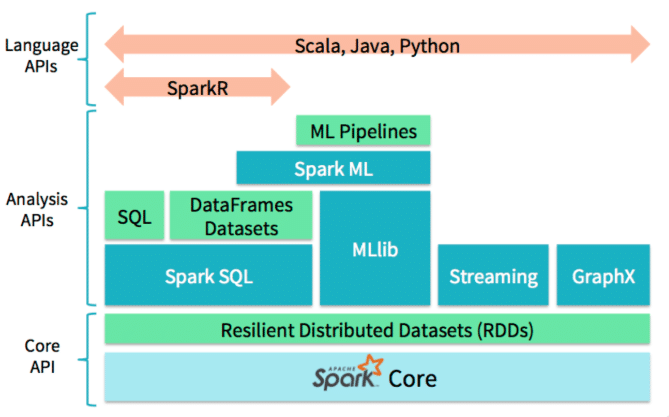
Sparkの統計処理、機械学習を分散処理するライブラリです。spark.mllibとspark.mlの二つのパッケージがあります。SparkのMLlibはMLに移行しつつあります。Spark2.0からはRDDベースのMLlib APIは保守のみになり、今後はDataFrameベースのAPIが標準になるそうです。 ここではPySparkでML APIを使い、相関行列を行います。
2.相関行列とは
相関係数とは、2つのデータの(直線的な)関係性の強さを −1 から +1 の間の値で表した数のこと。相関行列とは、相関係数を並べたものであり、その意味から対称行列になります。
相関係数の計算式
xと yの相関係数 rは次の式で求まる。
ここで、sxy はxとyの共分散
sx は xの標準偏差
sy はyの標準偏差
n は 2 変数データ(x, y) の総数
xi とyi は個々の数値
x̅ とȳ はそれぞれの平均値
相関係数は一般的に、
0.0~1.0 強い正の相関
0.4~0.7 正の相関
0.2~0.4 弱い正の相関
-0.2~0.2 ほとんど相関がない
-0.4~~-0.2 弱い負の相関
-0.7~-0.4 負の相関
-1.0~-0.7 強い負の相関
3.実験のコード
概要:
環境:Databricks Runtime: 5.5LTSML (Scala 2.11, Spark2.4.3)
データセット:モバイルおよびコンピューターのユーザーデータ
実験1:Pandasでの相関行列
実験2:Spark MLでの相関行列
可視化:seaborn matplotlib
3.1 データセットのロード
import urllib

urllib.request.urlretrieve("https://wiki.q-researchsoftware.com/images/b/b9/Ownership.csv", "/tmp/Ownership.csv")
dbutils.fs.mv("file:/tmp/Ownership.csv", "dbfs:/tmp/Ownership.csv")
display(dbutils.fs.ls("dbfs:/tmp/Ownership.csv"))
3.2 Pandasの相関行列
Pandasデータフレームを作成
import pandas as pd

pdf = pd.read_csv("/dbfs/tmp/Ownership.csv")
pdf = pdf.drop(columns=['None of these', 'None of these.1'])
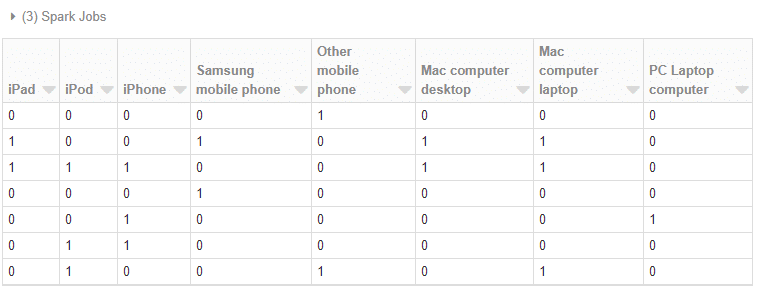
display(pdf)
Pandasでの相関行列
# pandasでの相関行列

pdf_corr = pdf.corr(method='pearson')
print(pdf_corr)
# method='spearman'でスピアマン、'kendall'でケンドールも指定可能
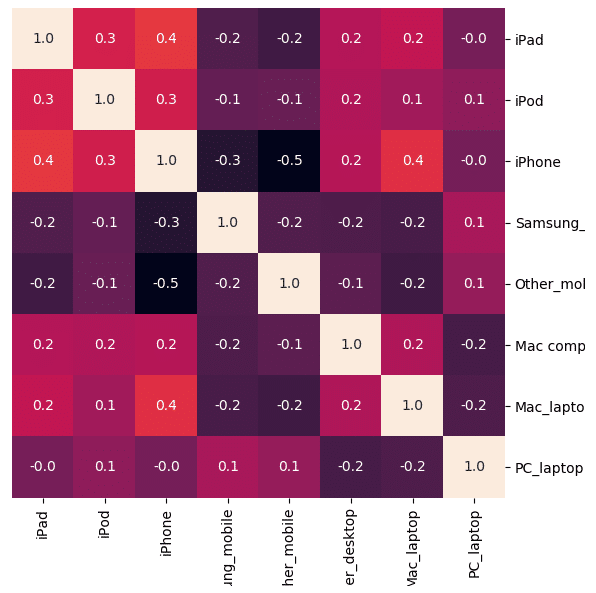
3.3 ヒートマップ表
# 可視化

import seaborn as sns
import matplotlib.pyplot as plt

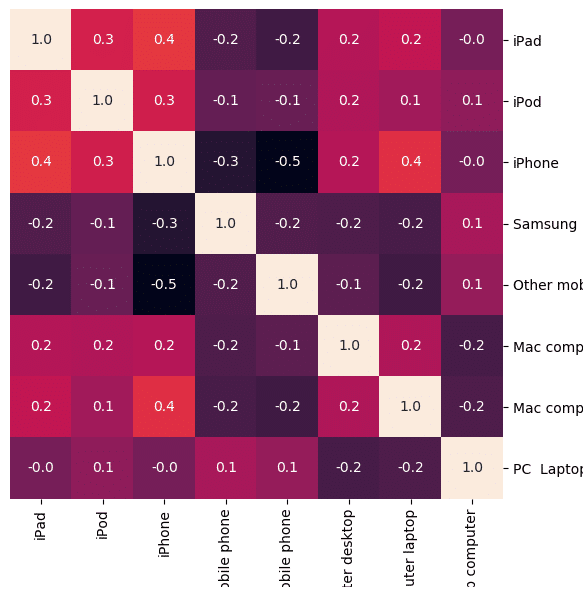
cm = sns.clustermap(pdf_corr, annot=True, figsize=(8, 8), col_cluster=False, row_cluster=False, fmt="1.1f")
cm.cax.set_visible(False)
display()
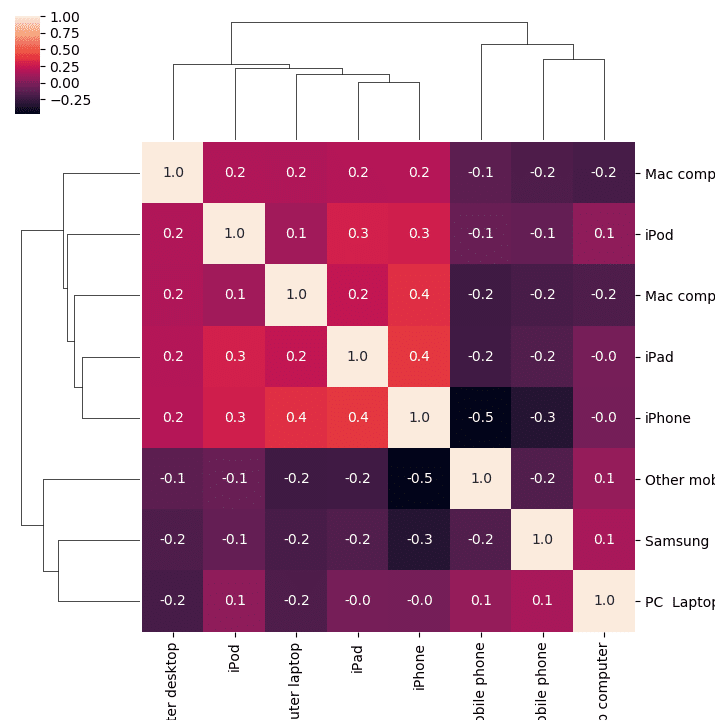
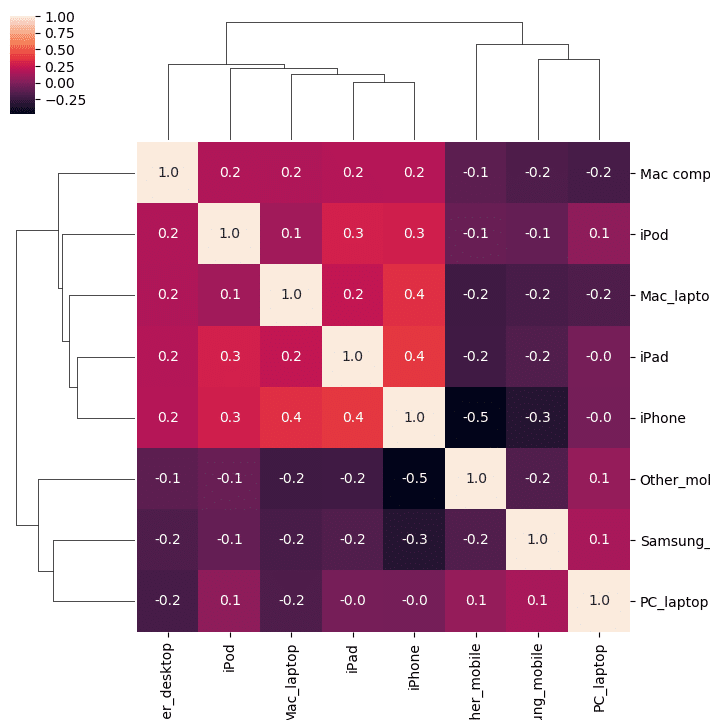
ヒートマップ表とクラスタリング
# 可視化

import seaborn as sns
import matplotlib.pyplot as plt
cm = sns.clustermap(pdf_corr, annot=True, figsize=(8, 8) , fmt="1.1f")
display()
3.4 Spark MLの相関行列
Sparkデータフレームを作成
### CSVファイルの読み込み

# CSVファイルのパス
file_path = "dbfs:/tmp/Ownership.csv"
# CSVファイルを読み込んでsdfのデータフレームを作成

sdf = spark.read.csv(file_path, header=True, sep=',', inferSchema=True)
# データフレームを表示
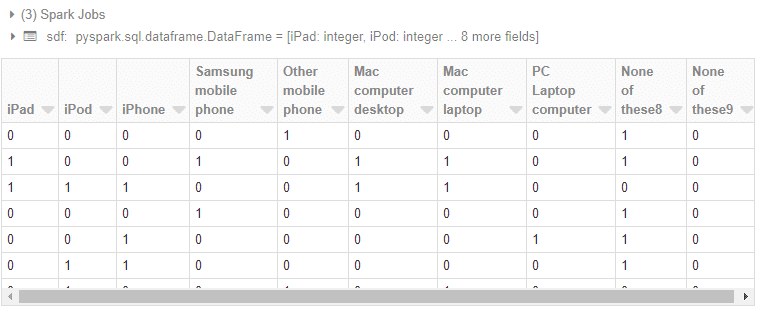
display(sdf)
データ加工(Feature作成)
from pyspark.ml.linalg import Vectors
from pyspark.ml.feature import VectorAssembler

assembler = VectorAssembler(
    inputCols=["iPad", "iPod", "iPhone", "Samsung mobile phone", "Other mobile phone", "Mac computer desktop", "Mac computer laptop", "PC  Laptop computer"],
    outputCol="features")

output = assembler.transform(sdf)
sdf2 = output.select("features")
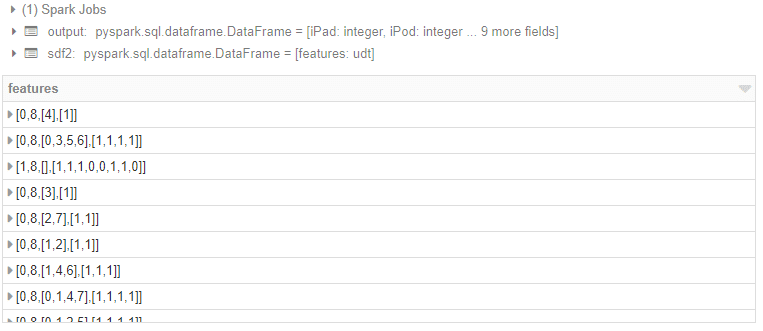
display(sdf2)
相関行列を計算
# SparkMLでの相関行列
from pyspark.ml.stat import Correlation

s_corr = Correlation.corr(sdf2, "features", "pearson").head()
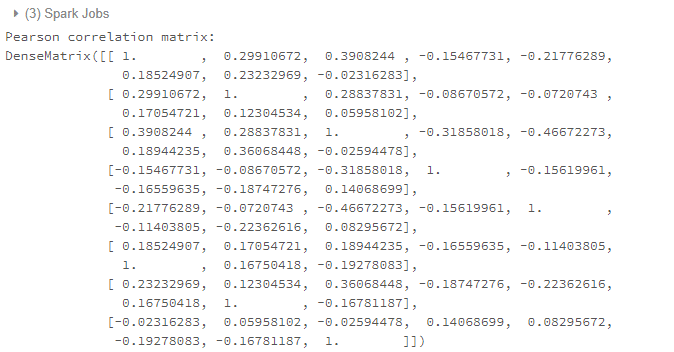
print("Pearson correlation matrix:\n" + str(s_corr[0]))
# 'spearman' でスピアマンを指定可能
Pandasデータフレームに変更
inputCols=["iPad", "iPod", "iPhone", "Samsung_mobile", "Other_mobile", "Mac computer_desktop", "Mac_laptop", "PC_laptop"]

s_corr_ls = s_corr[0].toArray().tolist()
s_corr_df = spark.createDataFrame(s_corr_ls, inputCols)
p_corr_df = s_corr_df.select("*").toPandas()
r_index = pd.Series(inputCols)
p_corr_df = p_corr_df.set_index(r_index)
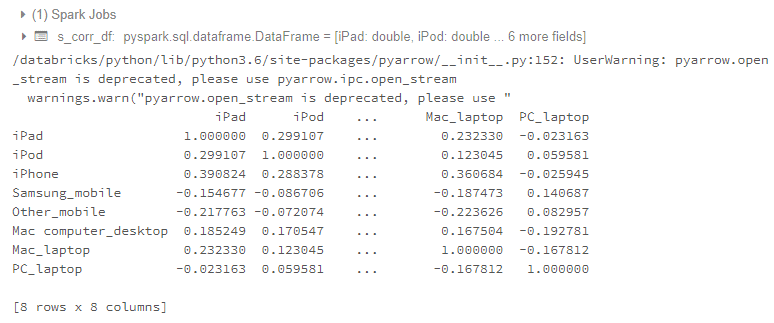
print(p_corr_df)
3.5 ヒートマップ表
# 可視化
import seaborn as sns
import matplotlib.pyplot as plt

cm = sns.clustermap(p_corr_df, annot=True, figsize=(8, 8), col_cluster=False, row_cluster=False, fmt="1.1f")
cm.cax.set_visible(False)
display()
ヒートマップ表とクラスタリング
# 可視化
import seaborn as sns
import matplotlib.pyplot as plt

cm = sns.clustermap(pdf_corr, annot=True, figsize=(8, 8) , fmt="1.1f")
display()
4. まとめ
今回の記事はPandasとSparkMLで相関行列を計算しました。SparkMLの場合、SparkMLは可視化のライブラリがないので、Pandasのデータフレームに変更して、Seabornで可視化しました。ちょっと手間になります。

