関連記事: NGBoost CatBoost LightGBM
![]()
![]()
![]()
![]()
目次
1. LogitBoostの概要
__1.1 LogitBoostとは
__1.2 LogitBoostのライブラリ
2. 実験・コード
__2.1 環境の準備
__2.2 ライブラリのインポート
__2.3. データロード
__2.4. データ加工
__2.5. モデル学習
__2.6. モデル評価
1. LogitBoostの概要
1.1 LogitBoostとは
LogitBoostは、バイナリまたはマルチクラス分類アルゴリズムの一つになります(一応回帰も可能です)。LogitBoost と AdaBoost は、どちらも加法ロジスティック回帰を行うという点で似ています。違いは、AdaBoost が指数損失を最小化し、LogitBoost がロジスティック関数の損失関数を最小化するように学習する事です。
1.2 LogitBoostのライブラリ
下記のようにScikit-learnライクに使う事ができます。
logitboost.LogitBoost(base_estimator=None, n_estimators=50, weight_trim_quantile=0.05, max_response=4.0, learning_rate=1.0, bootstrap=False, random_state=None)
パラメータの意味です。
base_estimator (object, optional (default=None))
classifierまたはregressorを指定することができます。 base_estimatorが指定されていない場合は、decision stump(分ける時に2値のフラグでわけます)が使用されます。
n_estimators (int, optional (default=50))
アンサンブルに使う決定木の数です。
weight_trim_quantile (float, optional (default=0.05))
各ブースティング反復で、サンプルの重み分布のこの分位よりも小さい重みを持つ観測値は、計算を高速化するために(その反復のみの)基本推定量を近似するためにデータから削除されます。
max_response (float, optional (default=4.0))
ベース推定量を適合させるときに許可する最大応答値(数値安定性)です。
learning_rate (float, optional (default=1.0))
学習率と呼ばれるパラメータになります。大きければ収束は早いですが、過学習になりやすくなります。
bootstrap (bool, optional (default=False))
Trueの場合、母集団となるデータから,母集団から重複を許してデータに重みをつけて取り出して再標本化をする手法になります。
random_state (int, None, optional (default=None))
乱数を制御するパラメータです。
2. 実験・コード
環境概要:
環境:Google Colab
データセット:scikit-leanの3種類のワインのデータセット
モデル:logitboost
モデル評価:Accuracy
2.1 環境の準備
!pip install logitboost
Successfully installed logitboost-0.7
2.2 ライブラリのインポート
import numpy as np
import matplotlib.pyplot as plt
import seaborn as sns
sns.set(style='darkgrid', palette='colorblind', color_codes=True)

from sklearn.datasets import load_wine
from sklearn.model_selection import train_test_split
from sklearn.metrics import accuracy_score, classification_report
from sklearn.manifold import TSNE

from logitboost import LogitBoost
2.3. データロード
目的変数::3種類のワイン(class_0、class_1、class_2)
説明変数:アルコール量、色などの13個の変数
全データ:178件
# データロード
data = load_wine()

# データ確認
data
{‘DESCR’: ‘.. _wine_dataset:\n\nWine recognition dataset\n…
‘data’: array([[1.423e+01, 1.710e+00, 2.430e+00, …, 1.040e+00, 3.920e+00,
1.065e+03],
[1.320e+01, 1.780e+00, 2.140e+00, …, 1.050e+00, 3.400e+00,
1.050e+03],
…,
[1.317e+01, 2.590e+00, 2.370e+00, …, 6.000e-01, 1.620e+00,
8.400e+02],
[1.413e+01, 4.100e+00, 2.740e+00, …, 6.100e-01, 1.600e+00,
5.600e+02]]),
‘feature_names’: [‘alcohol’,
‘malic_acid’,
‘ash’,
‘alcalinity_of_ash’,
‘magnesium’,
‘total_phenols’,
‘flavanoids’,
‘nonflavanoid_phenols’,
‘proanthocyanins’,
‘color_intensity’,
‘hue’,
‘od280/od315_of_diluted_wines’,
‘proline’],
‘target’: array([0, 0, 0, 0, 0, 0, 0, 0, 0, 0, 0, 0, 0, 0, 0, 0, 0, 0, 0, 0, 0, 0,
2, 2, 2, 2, 2, 2, 2, 2, 2, 2, 2, 2, 2, 2, 2, 2, 2, 2, 2, 2, 2, 2,
2, 2]),
‘target_names’: array([‘class_0’, ‘class_1’, ‘class_2′], dtype='<U7’)}
2.4. データ加工
データの分割を行う(訓練用データ 0.7 評価用データ 0.3)
X = data.data
y = data.target_names[data.target]
n_classes = data.target.size

# データをシャッフルし、トレーニング/テストサンプルに分割する
test_size = 1 / 3
X_train, X_test, y_train, y_test = train_test_split(X, y, test_size=test_size,
shuffle=True, stratify=y,
random_state=0)
2.5. モデル学習
logitboostモデルを設定し、学習します。
lboost = LogitBoost(n_estimators=200, random_state=0)
lboost.fit(X_train, y_train)
LogitBoost(base_estimator=None, bootstrap=False, learning_rate=1.0,
max_response=4.0, n_estimators=200, random_state=0,
weight_trim_quantile=0.05)
2.6. モデル評価
モデルAccuracyを行います。 テストの精度は0.98になります。
y_pred_train = lboost.predict(X_train)
y_pred_test = lboost.predict(X_test)
accuracy_train = accuracy_score(y_train, y_pred_train)
accuracy_test = accuracy_score(y_test, y_pred_test)
print('Training accuracy: %.4f' % accuracy_train)
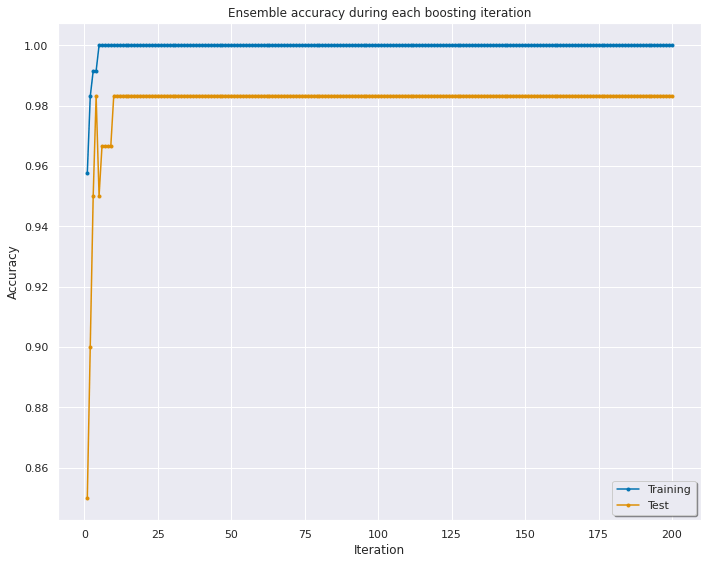
print('Test accuracy: %.4f' % accuracy_test)Training accuracy: 1.0000
Test accuracy: 0.9833
各イテレーションの精度を可視化します。10回目のイテレーションは精度が0.98になります。
iterations = np.arange(1, lboost.n_estimators + 1)
staged_accuracy_train = list(lboost.staged_score(X_train, y_train))
staged_accuracy_test = list(lboost.staged_score(X_test, y_test))

plt.figure(figsize=(10, 8))
plt.plot(iterations, staged_accuracy_train, label='Training', marker='.')
plt.plot(iterations, staged_accuracy_test, label='Test', marker='.')

plt.xlabel('Iteration')
plt.ylabel('Accuracy')
plt.title('Ensemble accuracy during each boosting iteration')
plt.legend(loc='best', shadow=True, frameon=True)

plt.tight_layout()
plt.show()
plt.close()